Machine Learning Models for Lung Cancer Prediction
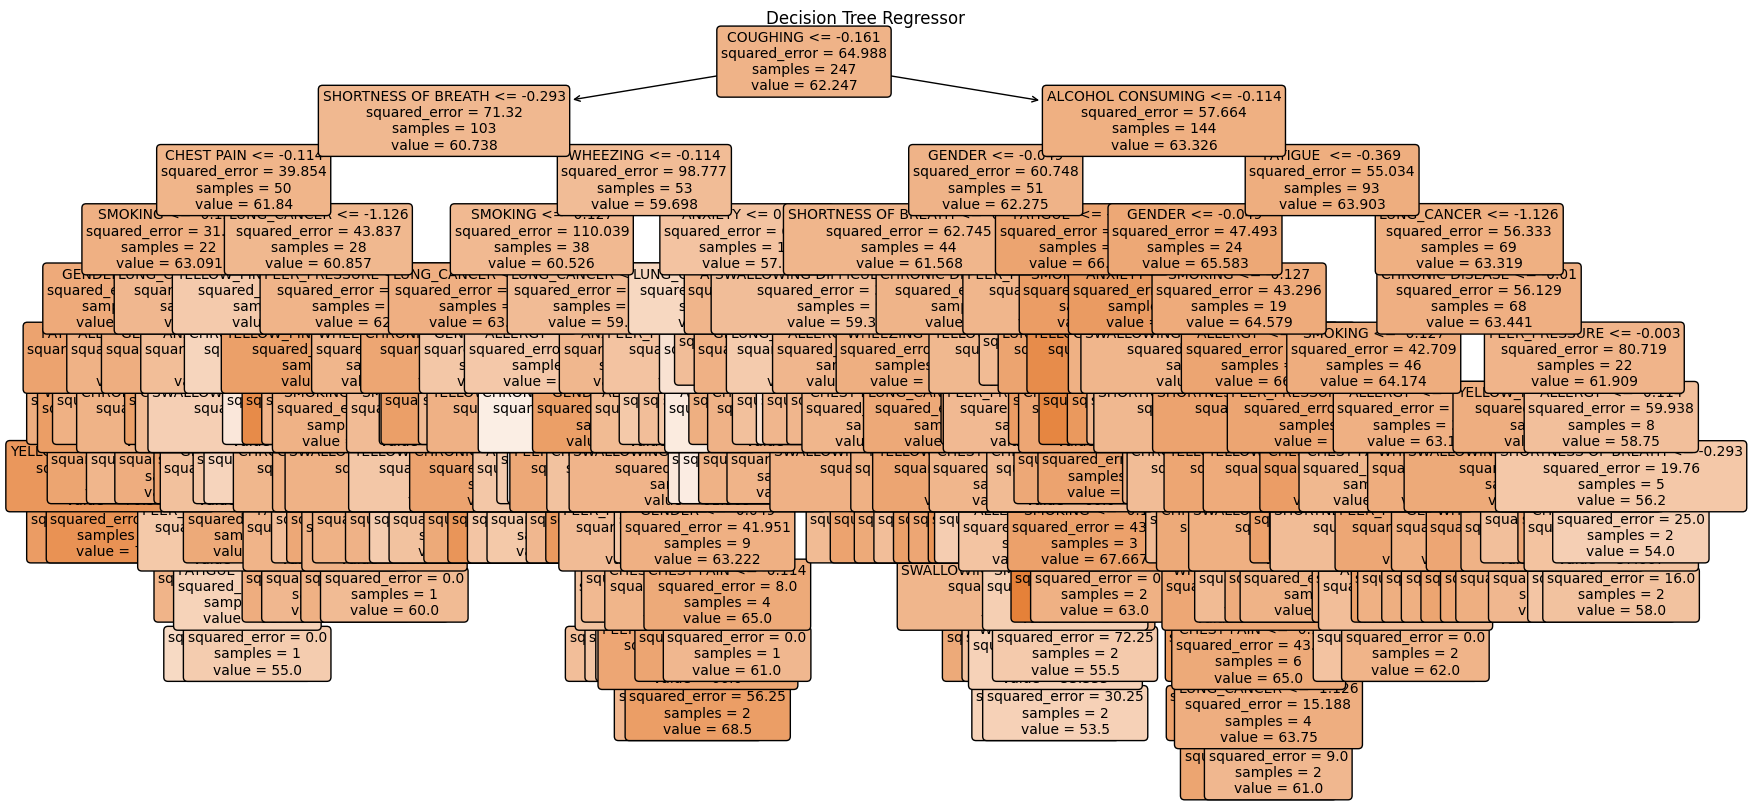
Decision Trees
A decision tree is a flowchart-like structure where each internal node represents a feature (or attribute), the branch represents a decision rule, and each leaf node represents the outcome. The model splits the dataset into smaller subsets while at the same time developing an associated decision tree incrementally.
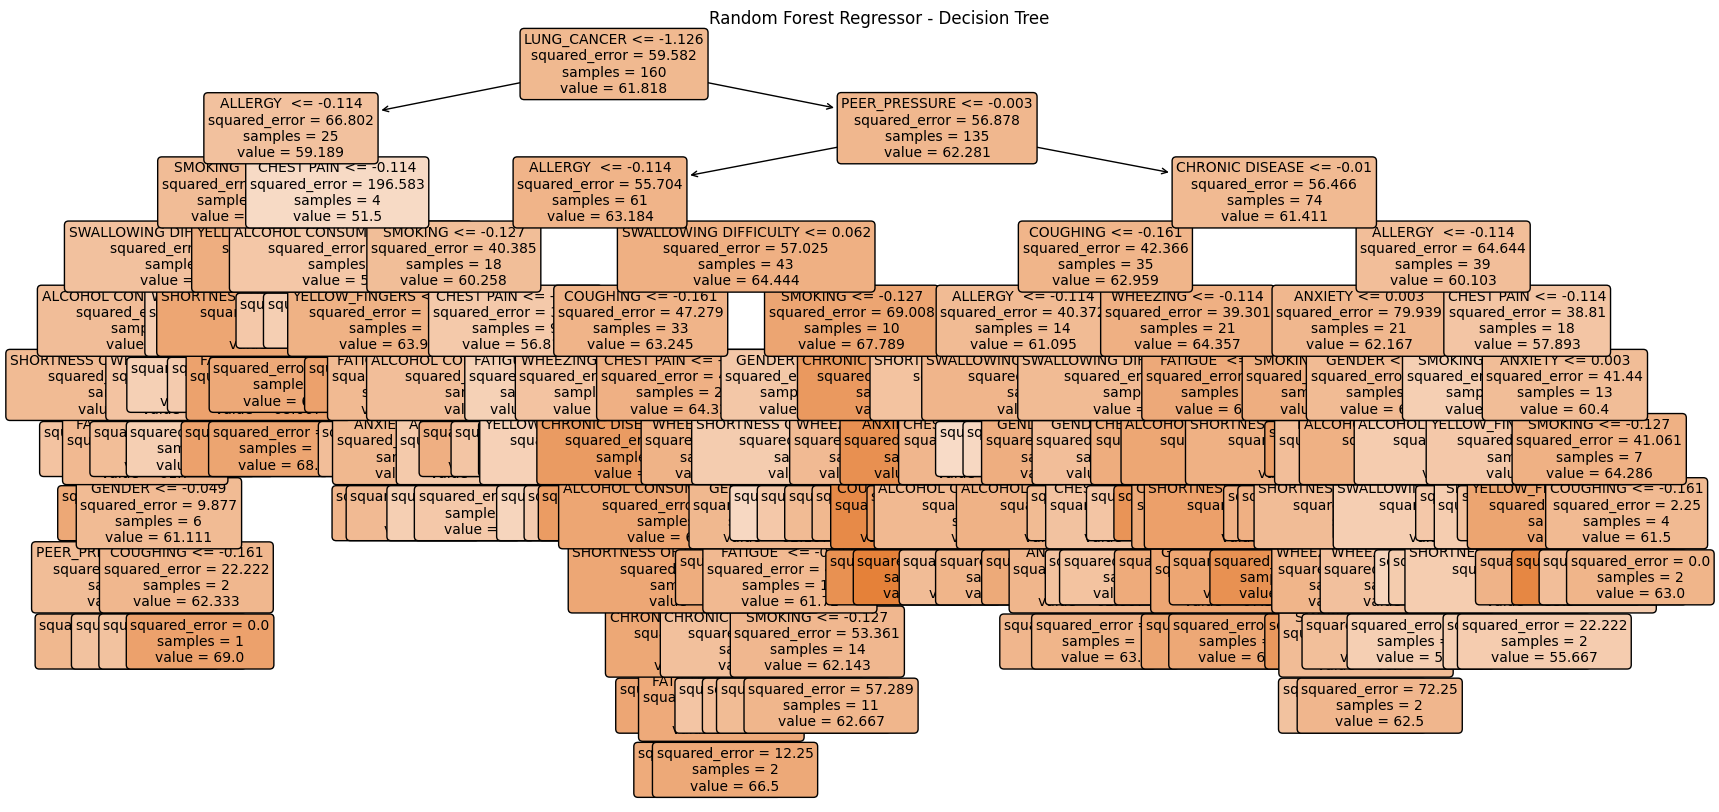
Random Forest
A random forest is an ensemble learning method that combines multiple decision trees to improve the overall performance. Each tree is trained on a random subset of the data, and the final prediction is made by averaging the predictions of all individual trees. This method reduces the risk of overfitting and improves accuracy.
Support Vector Machine (SVM)
A support vector machine (SVM) is a supervised learning model that finds the optimal hyperplane to classify data points in a high-dimensional space. SVMs are effective in high-dimensional spaces and are versatile with different kernel functions for nonlinear classification.
SVM Implementation
The following SVM implementation uses a grid search with cross-validation to find the best hyperparameters:
from sklearn.svm import SVC
from sklearn.model_selection import GridSearchCV, StratifiedKFold

param_grid = {
    'C': [0.1, 1, 10, 100, 1000],
    'gamma': [1, 0.1, 0.01, 0.001, 0.0001],
    'kernel': ['linear', 'poly', 'rbf', 'sigmoid']
}

cv = StratifiedKFold(n_splits=10, shuffle=True, random_state=42)
grid_search = GridSearchCV(SVC(), param_grid, cv=cv, scoring='accuracy', verbose=2, n_jobs=-1)
grid_search.fit(X_train, y_train)

best_svc = grid_search.best_estimator_
y_pred_best = best_svc.predict(X_test)
SVM Results
The SVM model provided the following results:
Classification Report:
precision recall f1-score support
0 0.71 0.62 0.67 8
1 0.95 0.96 0.95 54
accuracy 0.92 62
macro avg 0.83 0.79 0.81 62
weighted avg 0.92 0.92 0.92 62
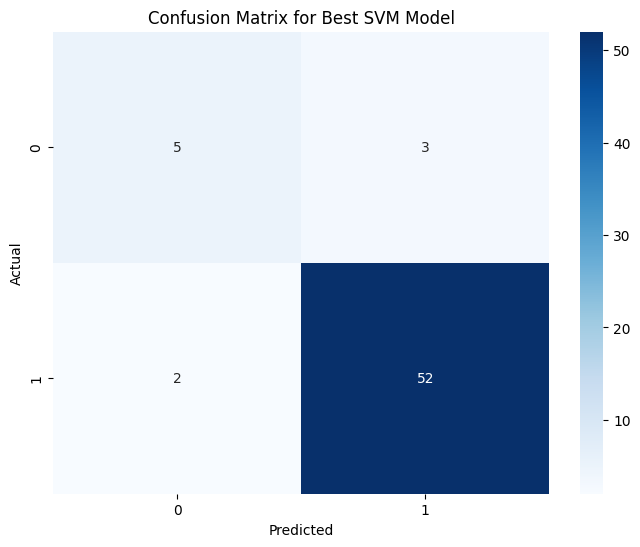
Confusion Matrix:
[[ 5 3]
[ 2 52]]The classification report shows the precision, recall, and f1-score for each class:
- Precision: The proportion of true positives among all positive predictions. Higher precision means fewer false positives.
- Recall: The proportion of true positives among all actual positives. Higher recall means fewer false negatives.
- F1-Score: The harmonic mean of precision and recall, providing a balance between the two.
- Accuracy: The overall proportion of correctly classified instances. Here, it is 92%, indicating the model's effectiveness.
The confusion matrix provides a detailed breakdown of the true positive, false positive, true negative, and false negative predictions:
- True Positives (TP): The number of correctly predicted positive cases (52).
- False Positives (FP): The number of incorrectly predicted positive cases (3).
- True Negatives (TN): The number of correctly predicted negative cases (5).
- False Negatives (FN): The number of incorrectly predicted negative cases (2).